We are drawn more towards colors, designs, and patterns than textual information. Data visualization takes advantage of this part of our natural tendency. Data visualization provides information in a visual form that is easy to understand, engaging, and effective.
What is data visualization?
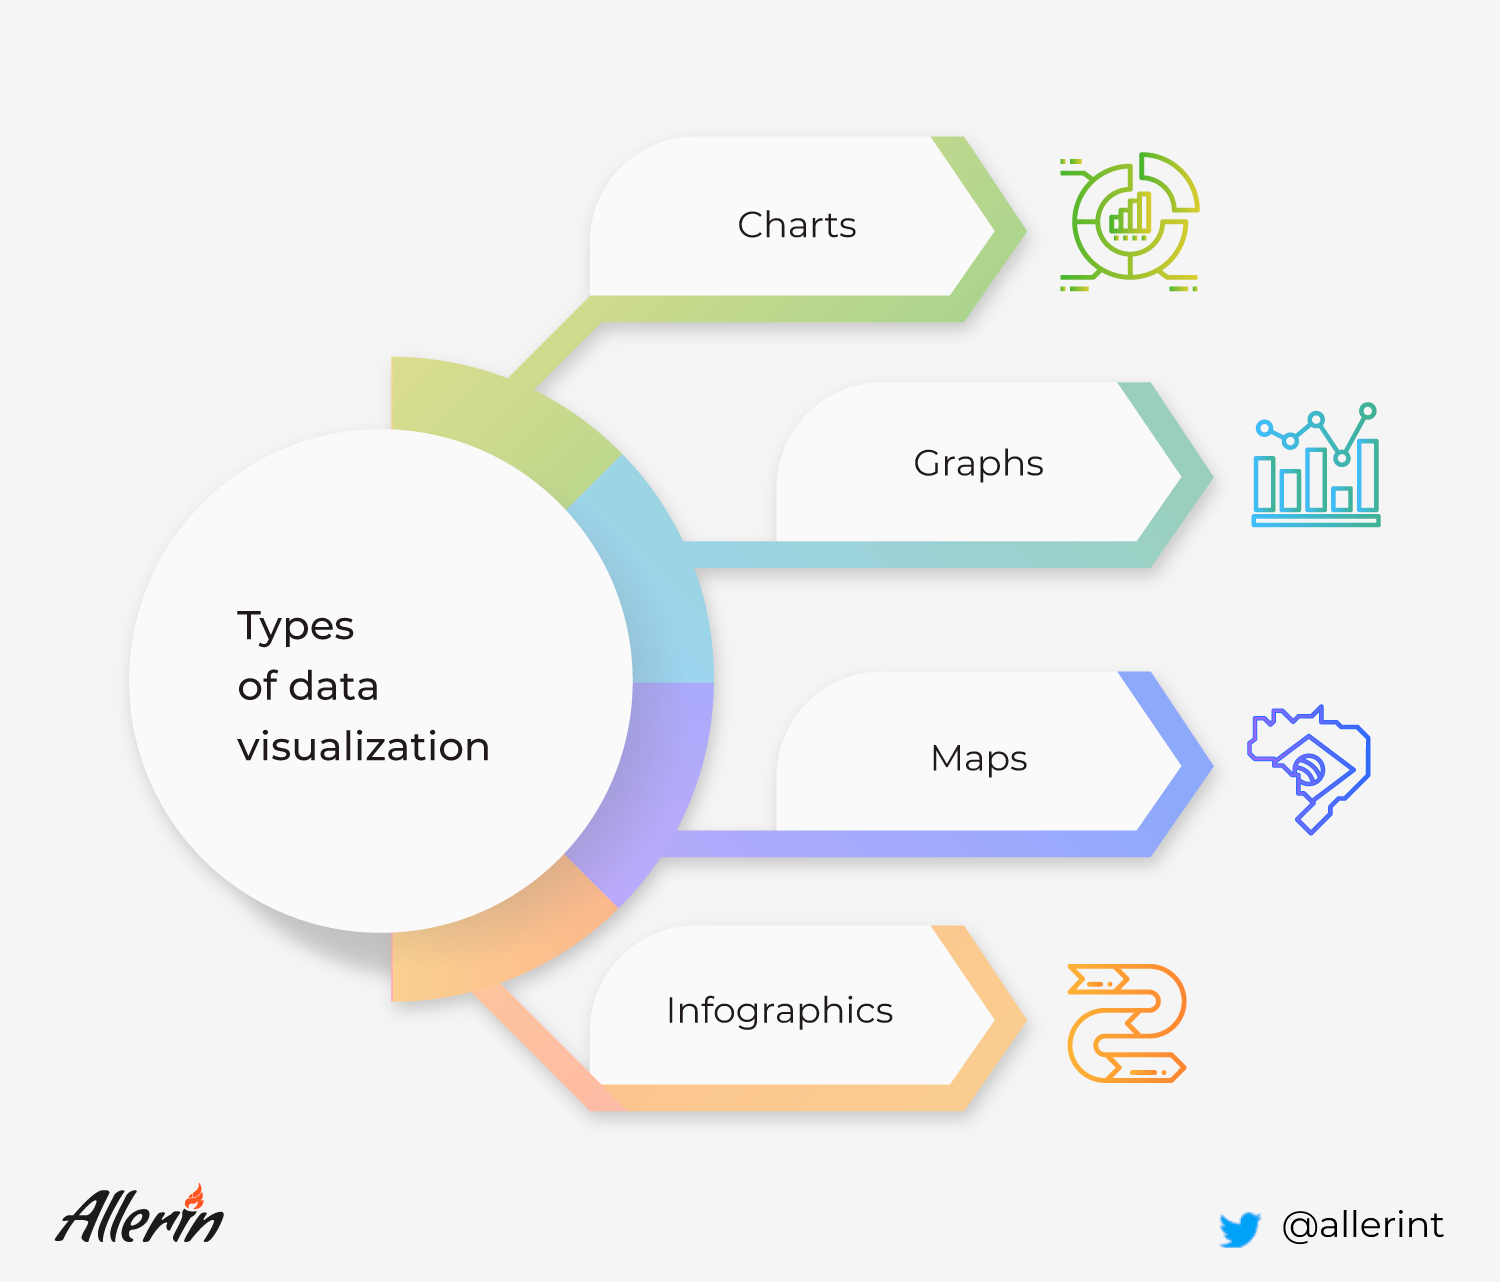
Data visualization is the graphical representation of information and data. In simpler terms, data visualization is the use of visual elements like graphs, charts, and maps to display information in a manner that makes it easier for individuals to understand.
Why is data visualization important?
Data visualization can result highly beneficial for business leaders as it enables them to make decisions quickly and efficiently by presenting information in a visual format. Some of the advantages of using data visualization include:
Provides improved insights
With data visualization, the information is represented in an easy-to-understand format. More insights can be derived by seeing the data in graphical or tabular formats than from plain textual ones. For instance, graphs and pie charts help to easily identify various parameters, trends, and patterns. Data visualization also makes it easier to compare and correlate different datasets. Thus, business leaders will have a better understanding of the data with data visualization.
Enables faster decision making
Data visualization brings speed. As data can be easily comprehended, business leaders can quickly act and make decisions. They won’t have to spend time analyzing data to recognize patterns or trends. As data visualization provides improved insights, leaders can make decisions that result in maximum benefit for the organization. It can, thus, help stay ahead of competitors.
How to use data visualization at your organization
Business leaders should primarily implement tools for data handling and analytics. They must ensure that the information provided by these tools are presented in an easily understandable visual format rather than long rows of text. For that, businesses need to invest in AI data tools that can convert textual information into graphs, charts, and maps. Businesses need to ensure that the data tools carry out the process with the highest accuracy and minimize human intervention. Currently, when data is converted into a visual context, it is done manually and is prone to errors. Thus, businesses must ensure that the conversion of data is error-free to improve their decision making.
We are all aware of the importance of data and data analytics. Data visualization is the cherry on top of the cake that makes it easy for organizations to understand and analyze data. If you’re implementing data tools, ensure that you also have a data science team with the adequate skills at your organization to gain maximum benefits from them.